
Shiba Inu – Market Dynamics and Recent Developments
Current Market Position
- Closing Price (2026‑08‑31): 0.00000514428 USD
- 52‑Week High: 0.0000148176 USD (2025‑09‑12)
- 52‑Week Low: 0.00000406497 USD (2026‑07‑16)
- Market Capitalisation: 3,031,210,643.83 USD
Recent Price Movements
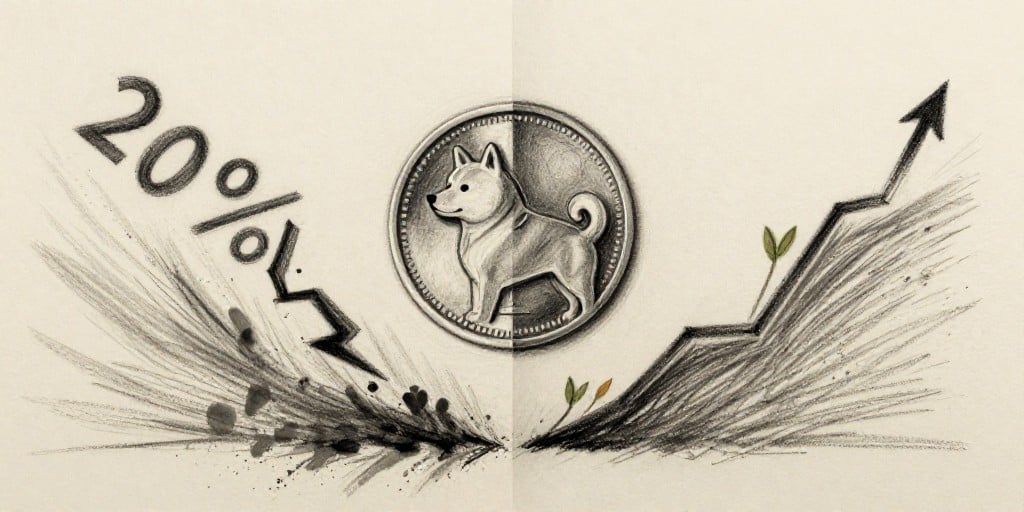
- On 2026‑09‑01, Shiba Inu (SHIB) fell 20 % from its late‑August high, erasing the gains accumulated during H2 2026.
- The 200‑day moving average, positioned at 0.0000069 USD, was breached and failed to be held above this level, indicating a lack of bullish momentum.
- A technical channel, marked in purple on TradingView, shows a slow recovery trajectory but remains under‑developed.
Sentiment Indicators
Netflows
- Netflows turned bearish on 2026‑09‑01, with approximately 145 billion SHIB moving toward exchanges. This shift suggests increased sell‑side pressure, as tokens moving to exchanges are potentially available for sale.
Exchange Outflows
- Exchange outflows declined 42 % on 2026‑09‑01, signalling a cooling in wallet activity. While reduced outflows can be interpreted as accumulation, the accompanying netflow shift mitigates this interpretation.
Burn Activity
- The daily burn rate spiked 1,020 % on 2026‑09‑01, driven by 20.82 million SHIB sent to dead wallets. The absolute quantity burned, while notable, represents a modest proportion of the total supply and does not constitute a major supply shock.
Analyst Outlook
- Cryptopotato.com identifies September as a historically weak month for meme coins, citing three potential reasons for a further decline in SHIB.
- Ambcrypto.com suggests that the recent pullback could present a buying opportunity if past trends repeat, but notes that a sustained bullish breakout remains elusive without broader crypto market support.
Summary
Shiba Inu’s recent 20 % price decline, coupled with bearish netflow activity and a reduced outflow rate, indicates heightened short‑term sell pressure. The substantial burn event adds a supply‑reduction narrative; however, the volume burned is relatively small compared to the circulating supply. Technical analysis shows the asset failing to maintain positions above key moving averages, and the overall market context in September suggests potential further weakness for the meme coin.